The “Protein data” panel shows details regarding the protein. The main part of the screen is shown in Figure 1. The top left side of the screen, there is an AlphaFold ID used in this example, A0A067QHV7. Below AlphaFold ID, there are two main sections to explore the protein's details. First section (top panel), informations about the lasso type, bold rectangle, 2L1 - two single lassos with the covalent loop pierced once by the tail, and categories voted by users, the lasso calculation may be evaluated by the user as correct in Lasso or as Artifact or Unsure. The gray panel, Information, brings the details as Protein name, Global pLDDT score, Species, Uniprot and Structure Prediction Model ID, PDB Structures (if they exist), Model Length, AlphaFold deposition date, and AlphaLasso deposition date. Second section (bottom panel), Protein information, shows the details about the Domain, Species (Full Name), Gene, PFAM codes, InterPro codes, and PDB structures (whole Protein).

Figure 1. Example of the main view of the protein information.
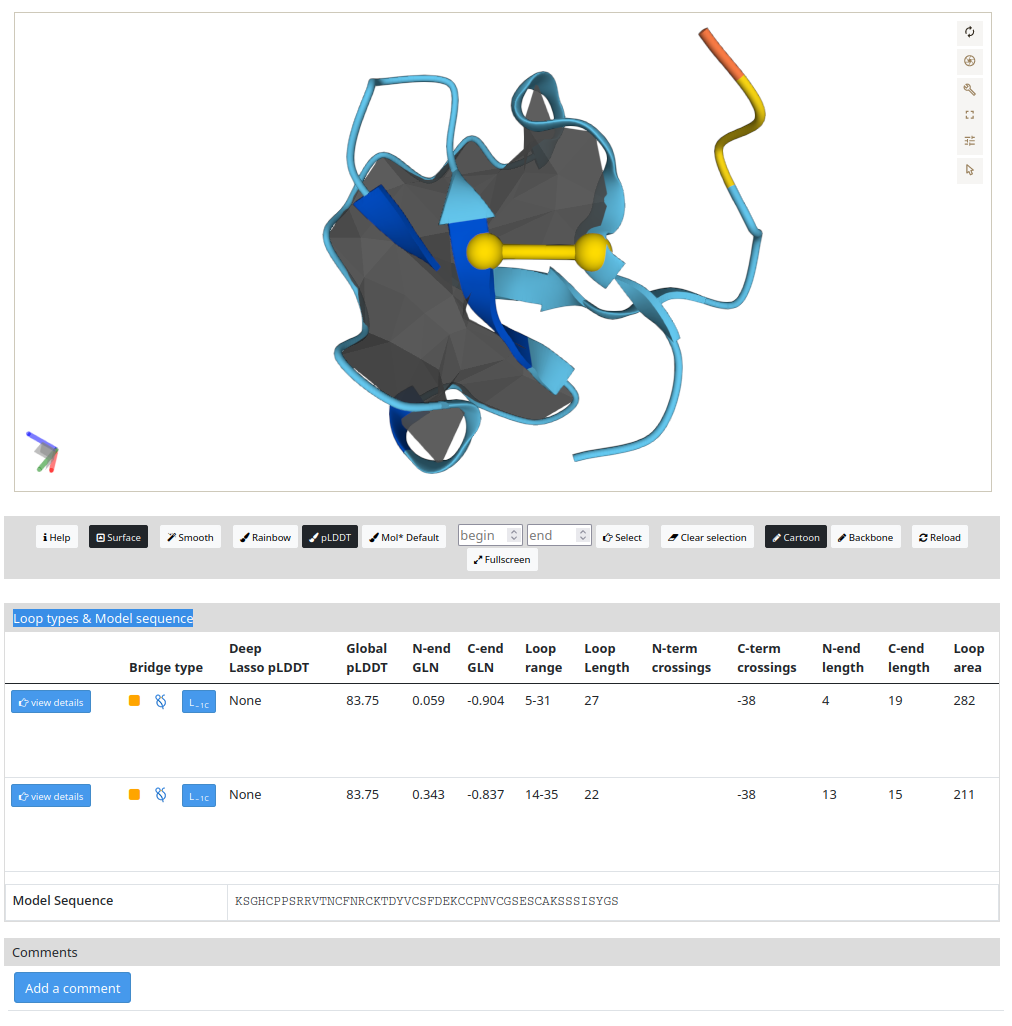
The lasso types & model sequence in Figure 2 shows the protein conformation (top), AlphaFold ID A0A067QHV7, and detailed information about the topology (bottom). In the protein representation (top) with the depiction of the surface (in gray color) spanned on a chosen covalent loop with cysteine, S-S bridge (bond in yellow color). The surface can be turned off and on by clicking the "Surface" button. The surfaces are displayed for each loop. The user can decide which closed loop has to be shown by clicking on the "View details” button. By default, the most complicated lasso type is presented. Also, there are different types of protein representation, e.g. Cartoon or Backbone. Additionally, three different color types, e.g rainbow, pLDDT, and Molecule Default. The geometry can be exported in the dialogue box on the right side in .glb format and edited in a different software, e.g ChimeraX or Pymol. In the same dialogue box, there is an option to save a .png figure. To understand how to enhance your protein visualization, we recommend to access MOL*(/’molstar/) (https://molstar.org/) Lastly, in the “smooth” button, you can smooth the protein chain, which will give a clear visualization, e.g. in complex cases, of the loop and the N- or C- crossings, (https://pylasso.cent.uw.edu.pl/).
Details about the topology are presented in the bottom panel, which the button view details and lasso type in the bridge type will highlight the minimal surface and the S-S bridge in the protein structure. Additionally, information as N- or C-end pLDDT, N- or C-end GLN, loop range and length, N- or C-term crossings, N- or C-end length, and Loop area are presented. Furthermore, for proteins with shallow lasso there is a button to visualize which residues are crossing the surface and they are presented in the N- o C-term crossings section. A protein sequence is presented below this section and the loop sequence can be visualized and it is highlighted in light blue color by clicking on the "View details” button. To conclude, the user can leave a comment related to the result by clicking on “Add a comment” in the “Comments” section.
The AlphaLasso website is licensed under CC BY 4.0![]()
![]()
